

Data‑Driven Primary Navigation Re-design at 1Password
Project
Primary Navigation Experiment & Revenue Impact Analysis
Role
Staff UX Designer
Timeline
Feb 2026 — Web (1Password.com)
Collaborators
Product Marketing, Data Science, Engineering, and Growth teams
Executive Summary
I led a hypothesis‑driven experiment to re-design the primary navigation of the 1Password website, aiming to reduce friction and increase user engagement. By leveraging a rigorous A/B testing framework and analyzing granular event data, I identified a statistically significant lift in navigation rate, directly correlating to increased product discovery and potential revenue growth.
The Challenge
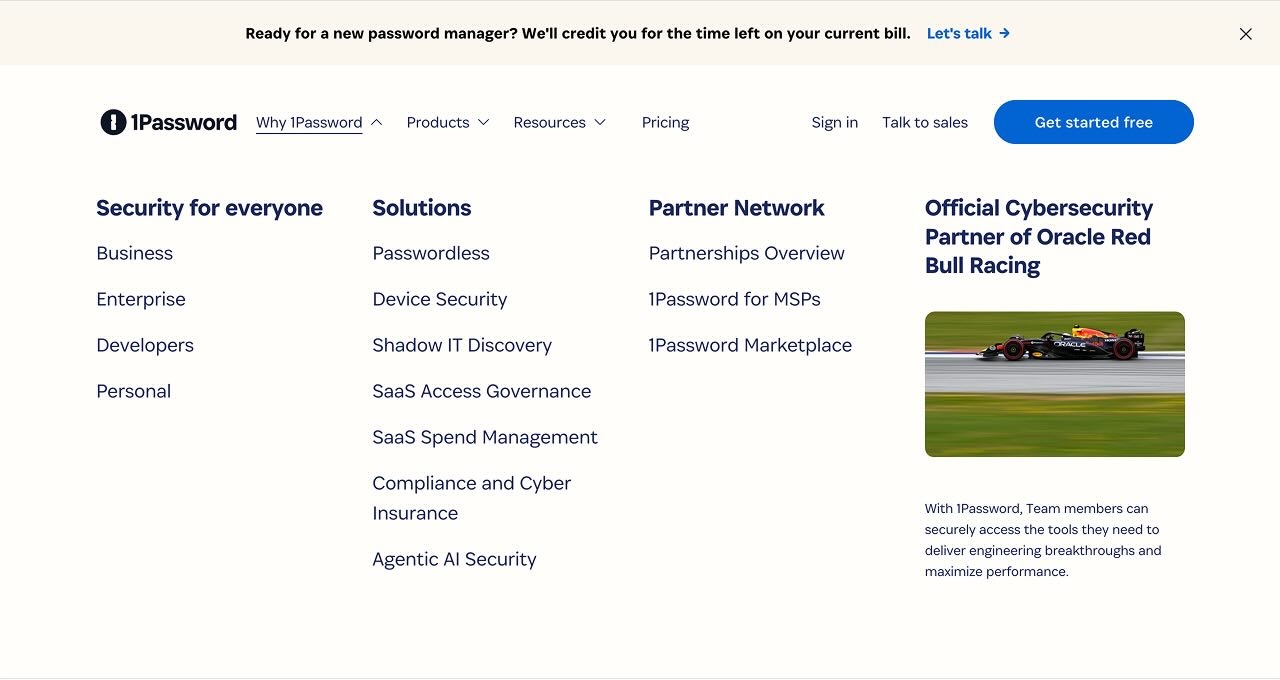
Users were not effectively engaging with the primary navigation, limiting their exposure to product features and conversion opportunities. I hypothesized that a re-designed navigation structure would improve discoverability, driving higher engagement metrics.
Product Marketing was developing a point of view on Extended Access Management, a new approach to offering Enterprise-grade security products to manage devices, user identities, and sensitive credentials. 1Password continues to offer revelant consumer password manager plans, and users were confused about where to find these products as we introduced more business software offerings
My Role & Contributions
- Strategy & Hypothesis: Defined success metrics and formulated hypothesis.
- Cross‑Functional Leadership: Partnered with Data Science and Engineering.
- Experimental Design: Created treatment variant focusing on clarity and CTAs.
- Data Analysis: Led statistical analysis using SQL and Z‑tests.
- Revenue Attribution: Quantified impact by correlating navigation lift with conversion.
Process & Execution
1. Hypothesis & Metric Definition
Navigation Rate defined as % of homepage viewers clicking through.
Secondary metrics: TOFU sign‑up clicks and Contact Sales interactions.
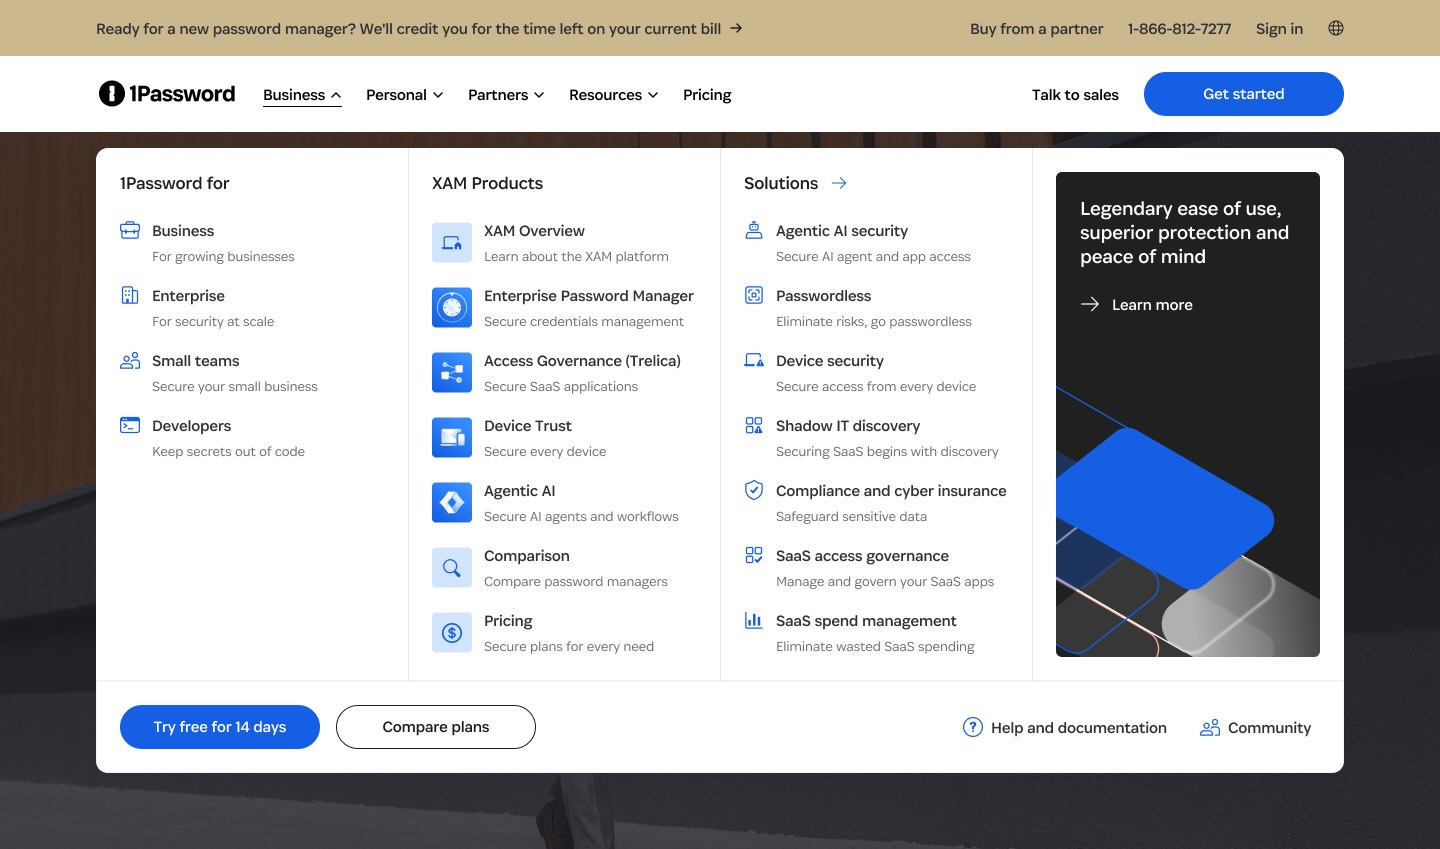
I led a workshop with senior leaders to shape strategy of how to present our products offerings in the new information architecture of the primary navigation.
Decision: I helped the executive group come to the conlusion that a clear split between Personal and Business offerings was necessary for both the navigation, and the primary website Homepage.
2. Design & Collaboration
Collaborated with Product Marketing; implemented the new variant of the primary navigation via feature flags.
Collaborated with engineers to update the Homepage and Pricing pages to display a Personal/Business toggle to help users find the plans and products that are relevant to them.
3. Launch & Analysis
The experiment ran Feb 5–17, 2026.
I extracted event data from GA; used one‑sided two‑proportion Z‑tests.
Results & Effectiveness
| Metric | Control | Treatment | Lift | Significance |
|---|---|---|---|---|
| Navigation Rate | 8.18% | 9.76% | +1.58% | Significant |
| TOFU CTR | 6.62% | 6.83% | +0.21% | Not Significant |
| Contact Sales | 1.19% | 1.15% | -0.04% | Not Significant |
Revenue Impact & Business Value
Revenue Impact: 1.58% lift across ~440k visitors ≈ 7,000 additional users engaging with product ecosystem.
Increased navigation drives users deeper, exposing them to features, boosting sign‑ups and enterprise inquiries.
Validated design pattern applicable globally.
Opportunity to optimize the post‑click experience.
Key Takeaways & Leadership
- Data‑Driven Design: SQL and statistical testing validated hypotheses.
- Cross‑Functional Collaboration: Aligned Product, Engineering, Data Science.
- Strategic Thinking: Recognized navigation as revenue lever.
- Staff‑Level Impact: Led analytical framework, mentored juniors.
Next Steps
- Optimize post‑click experience to convert increased navigation.
- Expand redesign to mobile and regional variants.
- Conduct qualitative research to understand user resonance.
Hiring Manager Note
This case study highlights my ability to operate at the intersection of design, data, and business strategy. I define hypotheses, lead rigorous experiments, and quantify revenue impact.